PIXELHUE
Keying and Cut & Fill Functions
(b)
Keying and Cut & Fill Functions
(b)
3.What is the Cut&Fill Function?
3.1 Definition of Cut&Fill
The Cut & Fill module mainly uses the brightness information of the selected Cut layer as the transparency for the Fill layer, enabling the
cutting and filling process between the two layers.
3.2 Application Scenarios
3.2.1 Irregular Layer Scenes
The Cut & Fill Function can be used in scenarios that require special shape display effects, such as confession events or various gala
events. As shown in Figure 3.1, the leftmost image represents the Fill layer, while the middle image is the Cut layer. The Cut layer is a
grayscale image, and the brightness information of the Cut layer is used as the transparency information for the Fill layer. Specifically, the
Fill layer has a transparency of 0 within the heart-shaped area, allowing it to be fully visible, while outside the heart-shaped area, the
transparency is 100%, making the Fill layer completely invisible.
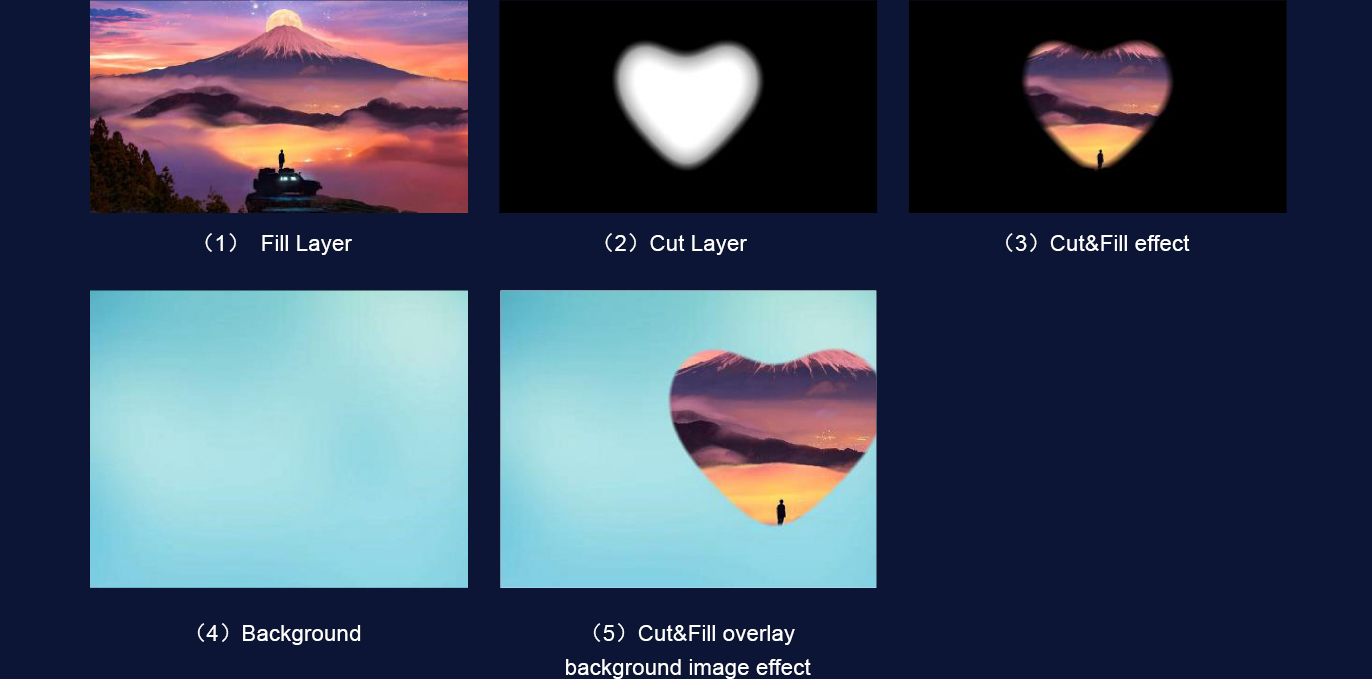
Figure 3.1 Special modeling application scenarios
3.2.2 Overlaying Identification Information Scenes
Users can create image content where the effective information parts are white or colorful, while other areas are black. This image content
can be used as both the Fill layer and the Cut layer, utilizing the layer's own brightness information as its transparency value. After
processing, the black areas of the layer can become transparent, preserving the colorful effective identification parts of the image.
Additionally, by adjusting the transparency curve of the Fill layer, the transparency of the effective identification parts can be fine-tuned to
achieve the best effect. The processed Fill layer can then be overlaid with other layers to display the identification information.
As shown in Figure 3.2, 'PIXELHUE' in image (1) is the blue valid identifier, and the rest of the image is pure black. This image is used
both as the Fill layer and the Cut layer. After processing, the transparency of the black areas becomes 0, while the valid identifier's
transparency is set to 1. After overlaid with the image (2), the background, the final image effect can be achieved as it shown in image (3).
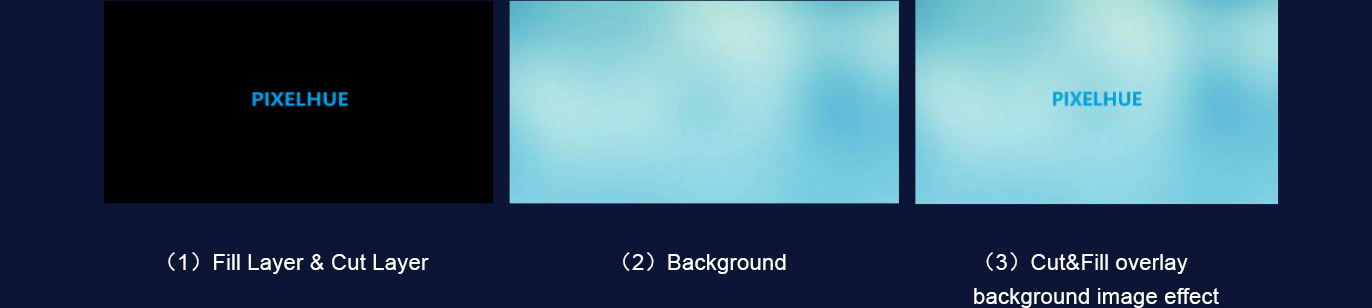
Figure 3.2 Overlaying Identification Information Scenes
This application scenario can also be realized with luma keying.
4.PIXELHUE Cut&Fill Function Application
4.1 Software UI Introduction
For the Q series products, the content displayed in the Cut layer can be selected from the input source or the image library. In addition to
user-imported images, the library includes 10 built-in graphics, as shown in the image below.
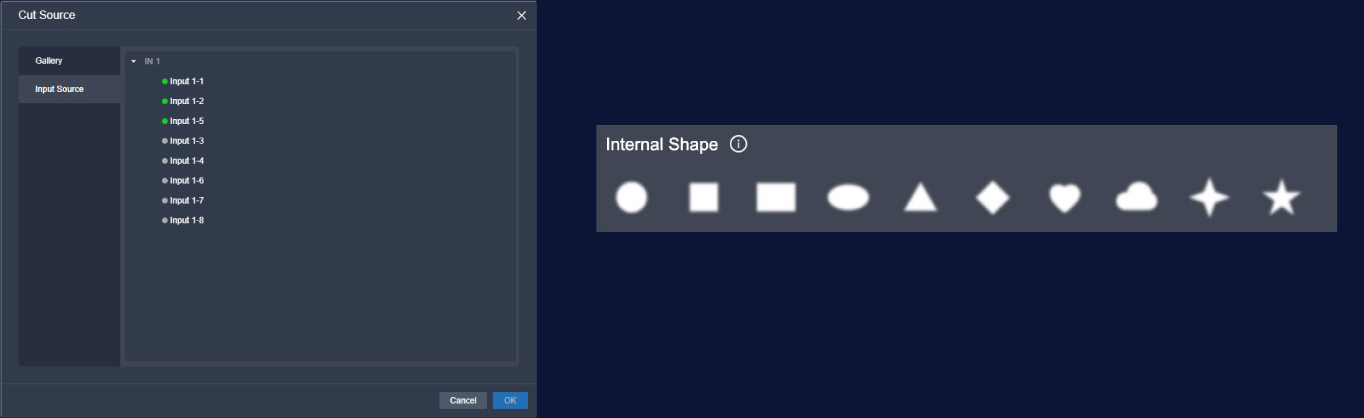
For the P series products, the content displayed in the Cut layer can only be selected from the input source.
4.2 Cut&Fill Function Application (Q8 as an example)
The following example illustrates the usage effects of the Cut&Fill function. Select a layer to enable this feature, choose the built-in oval
graphic as the Cut layer source, and keep all other parameters at their default values.

After the Cut & Fill process, the black areas of the Fill layer become transparent. By layering a background underneath the Fill layer, the
following effect can be achieved.

By enabling the inverse color for the Cut layer, the white areas of the Cut layer are changed to black, and the black areas are changed to
white. The final processed Fill layer's transparent areas become opaque, while the opaque areas are made transparent, achieving the
effect shown in the following image.

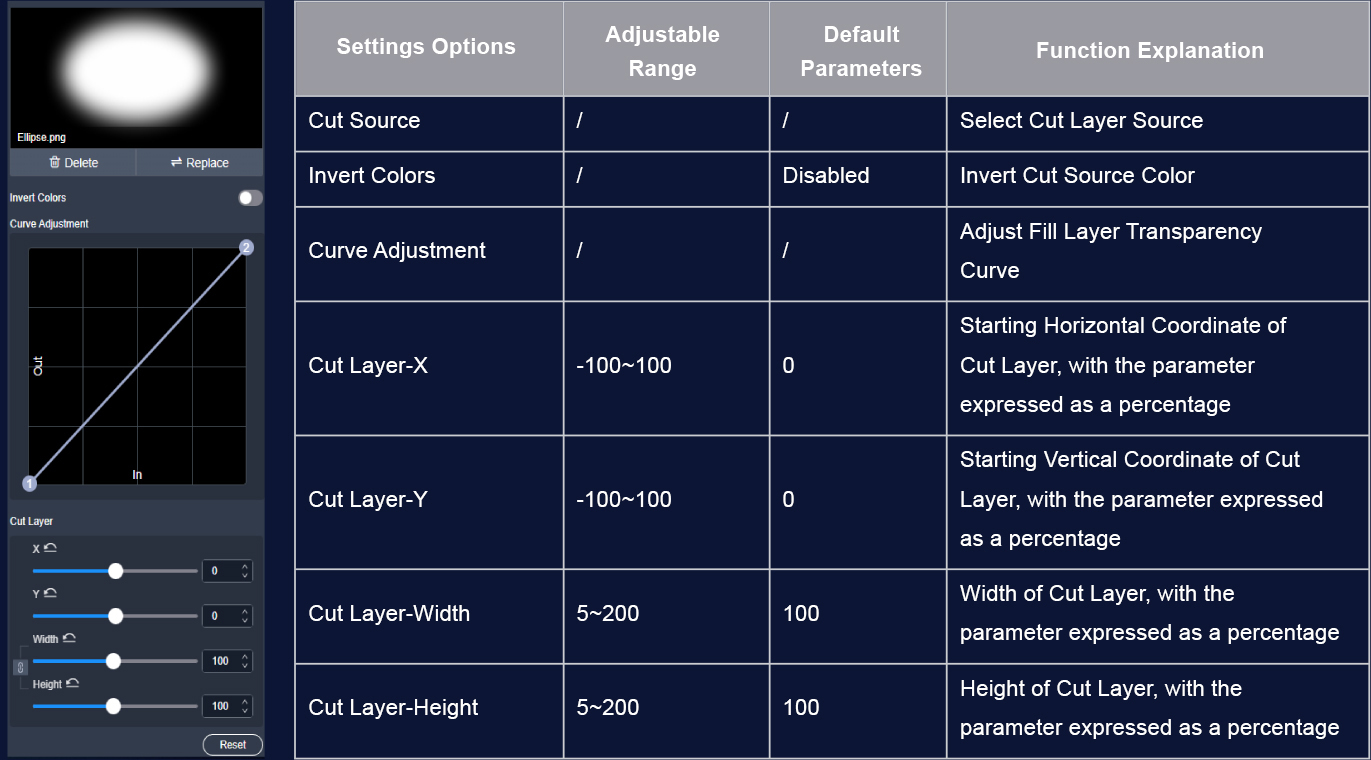
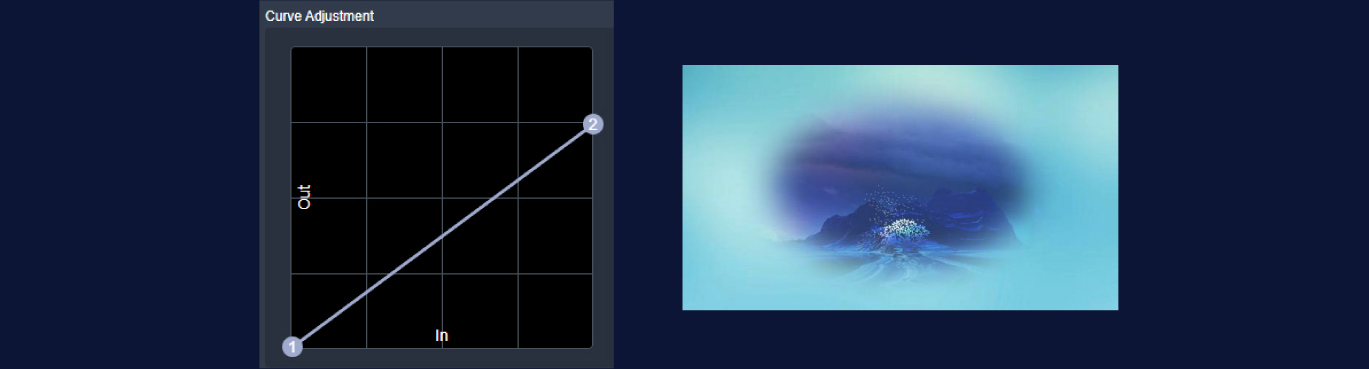
Fill Layer Transparency Curve Adjustment is mainly used to adjust the mapping range of transparency. The horizontal direction represents
the transparency value before mapping, and the vertical direction represents the transparency value after mapping. Point 1 represents the
starting point of mapping, and point 2 represents the end point of mapping. Take the following figure as an example, the horizontal
coordinate of point 1 is 50% and the vertical coordinate is 0, which means that the transparency of the area below 50% will be mapped to
0; the horizontal and vertical coordinates of point 2 are both 100%, so no mapping will be done. After the adjustments, the areas along the
edge of the ellipse with an opacity of less than 50% become completely transparent. The processed image shown below demonstrates
that the outline of the ellipse is now clearer.

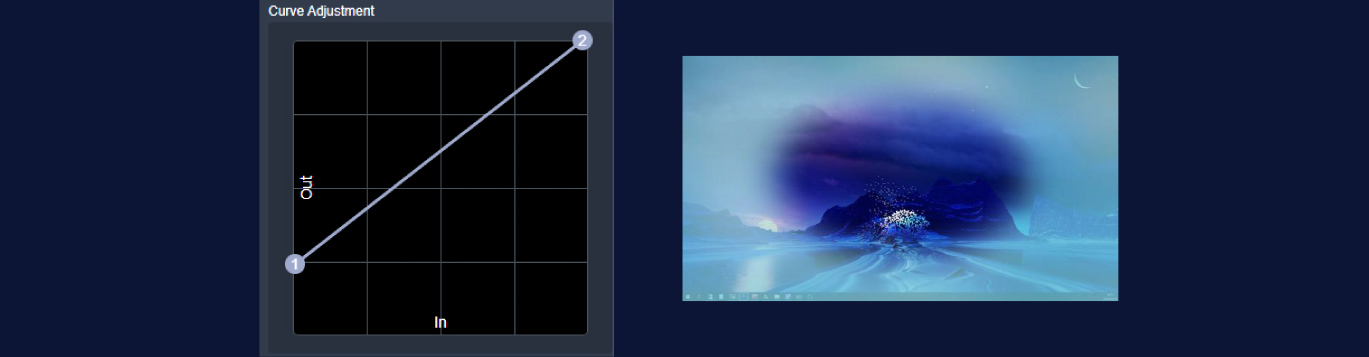
Based on the previous curve adjustments, the horizontal coordinate of Point 2 is set to 50%, indicating that areas with an opacity of more
than 50% are mapped to 100%. Combined with the adjustment at Point 1, the semi-transparent areas along the edge of the ellipse are
now mapped to either 0 or 100%. As a result, there are no semi-transparent points in the ellipse's edge, giving it a sharper appearance.

By lowering the horizontal coordinate of Point 2 by 25%, the areas with an opacity of 100% are now mapped to 75%. After this adjustment,
the regions inside the ellipse that were previously completely opaque will now exhibit a semi-transparent effect.
By raising the horizontal coordinate of Point 1 by 25%, the areas with an opacity of 0 are now mapped to 25%. After this adjustment, the
regions outside the ellipse that previously had an opacity of 0 will now display a semi-transparent effect.
Above is the keying and Cut&Fill functions. Please contact PIXELHUE technical support if you have any problems with the program.